Faculty/Staff Data Viz Gallery 2025
Faculty/Staff Data Viz Gallery 2025
VOTE HERE ›Trends in High School GPAs among Incoming Freshman Classes of Big Ten Schools
Description
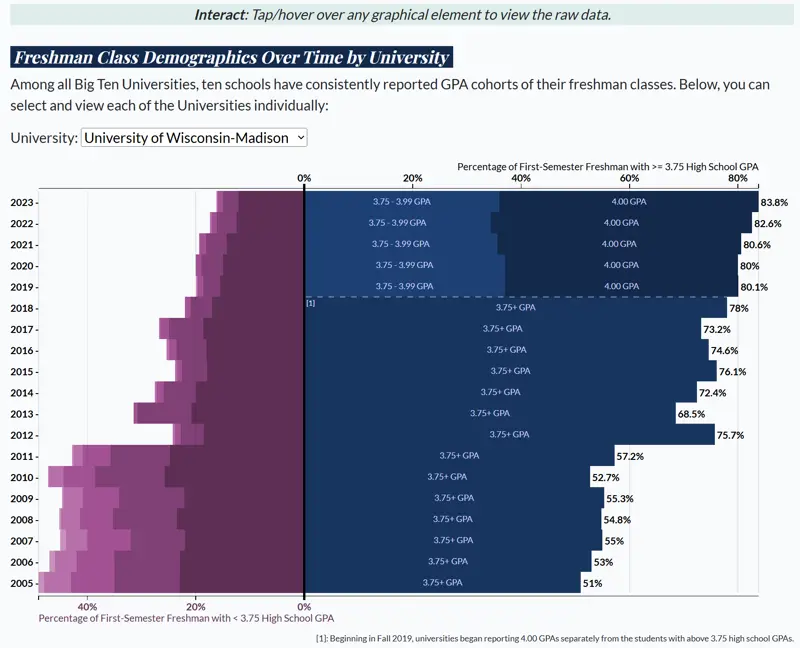
In Fall 2023, the University of Wisconsin-Madison reported a record 83.8% of their incoming, first-semester freshman class reported an unweighted high school GPA of at least 3.75. Among those students, nearly half (47.8%) of the incoming freshman class reported a perfect 4.00 GPA. Several research papers have studied the multi-decade trend of GPAs increasing over time, but we found no widely available data exploring the impact of the Big Ten. This work explores the first-semester freshman demographics published by all sixteen Big Ten schools.
Specifically, this work primarily focused on the percentage of students in each freshman class that have a high school GPA of at least 3.75. Nerd out with the data with several interactive visualizations that let you do a deep dive into the high school GPAs of the incoming freshman classes across the Big Ten over the past 20 years!
Authors
Wade Fagen-Ulmschneider & Louisa Zhang - University of Illinois
Student Visualizations of Large-Scale Physical Simulations
Description
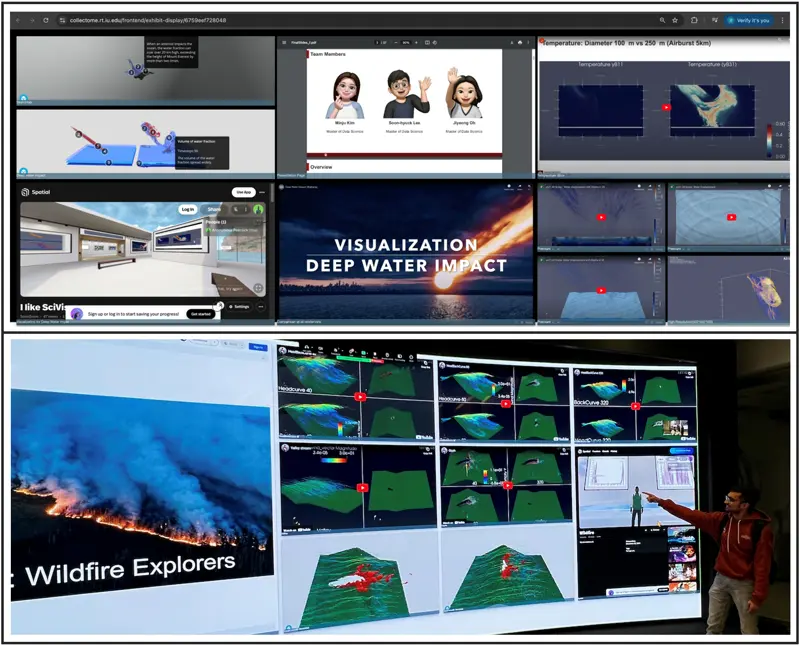
For their semester projects, students studying scientific visualization at Indiana University were asked to use ParaView, a flexible and scalable open-source software tool, to analyze and visualize very large datasets of physical phenomena. These data sets were selected from past IEEE Scientific Visualization challenges and included simulations of wildfire spread, asteroid impacts, sea currents, and mantle convection, each totaling hundreds of gigabytes of data across multiple simulation runs and conditions.
Students were asked to assess past work from published contest submissions and prior student work, ideate on improvements, and implement those improved visualizations at scale using ParaView running on IU’s research cyberinfrastructure (which includes high-throughput computing, remote desktops, high-performance storage, and large-scale display walls.) Students were also asked to develop an outreach or education component to complement the more technical visualizations designed for scientific audiences. The final visualizations were deployed to various cloud platforms to facilitate open sharing. These include YouTube for videos, Sketchfab for 3D models, Spatial.io for collaborative environments, and Google Drive for images and slide decks. Students used IU’s Collectome tool to arrange their various visual assets into a cohesive, engaging, and interactive visual display.
The student submissions for Fall 2024 can be viewed online at the IU Collectome. (https://collectome.rt.iu.edu/frontend/home ) The screenshot and photograph above highlight two well-crafted projects on asteroid impacts and wildfire spread, with the photo showing the visual impact of displaying a Collectome on a large-scale LED wall. These projects and many other student projects from 2024 and previous years can be found by browsing or searching from the Collectome home page.
Authors
Eric Wernert and IU Scientific Visualization students - Indiana University
Generative AI in Teaching and Learning
Description
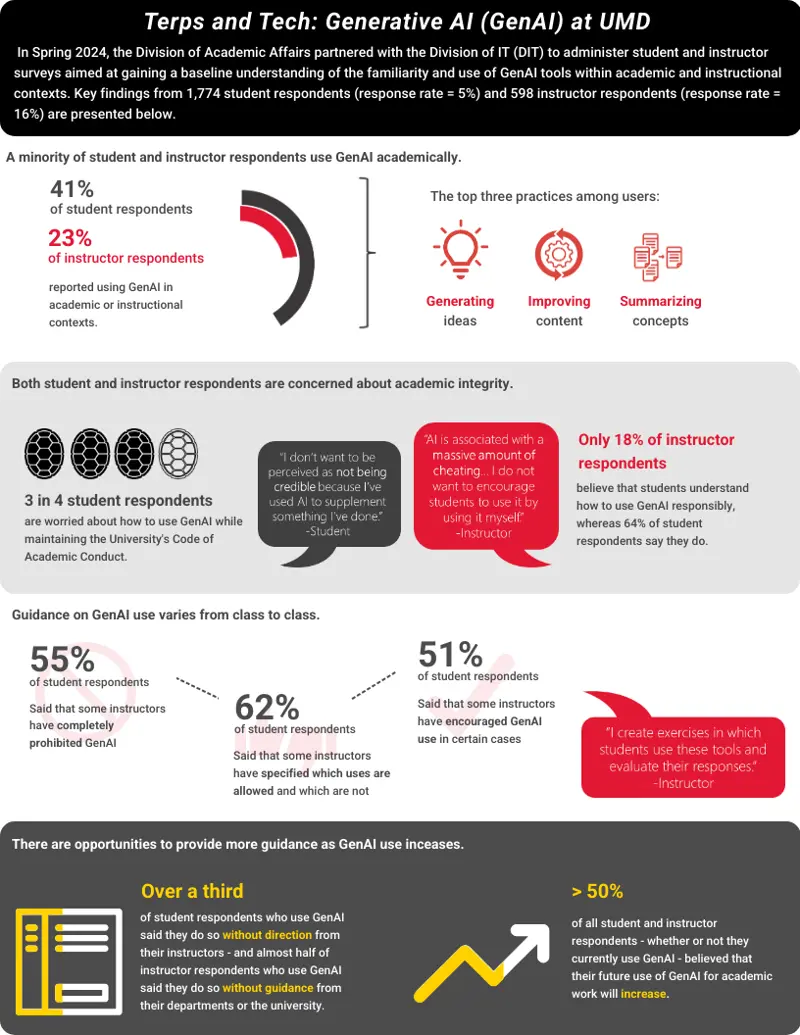
In Spring 2024, the University of Maryland conducted a campus-wide survey to gain a baseline understanding of students’ and instructors’ familiarity and use of generative AI (GenAI) tools within academic and instructional contexts. This visualization summarizes key findings from that survey, while providing different avenues for readers to explore the results further.
Authors
Jonathan Engelberg, Tiffany Pao, Alia Lancaster, and Blaize Shiebler - University of Maryland
Michigan School Safety Initiative (MSSI)

Description
The Michigan School Safety Dashboard represents quantitative survey data collected from Michigan K-12 superintendents, principals, instructional and non-instructional staff, and community members pertaining to the safety measures of their schools and community. The dashboard allows the public and school safety community-at-large to view aggregated survey responses related to risk assessments, safety preparedness, activity implementation, barriers and more from the state and by region.
Author
Isabella DeMino, Evaluation Specialist, Institute for Firearm Injury Prevention - University of Michigan
2003-2022 Big Ten Athletics

Description
These dashboards utilize publicly available data from Equity in Athletics (EADA - ope.ed.gov/athletics) to provide interactive reporting on Big Ten Athletics athlete participation and team revenue and expense data from 2003-2022. They include comparisons across all institutions, drill-downs into Men’s and Women’s teams at the institution level, and time series visualizations.
Author
Morgan Patterson - Michigan State University
UMN Brief Website Dashboard
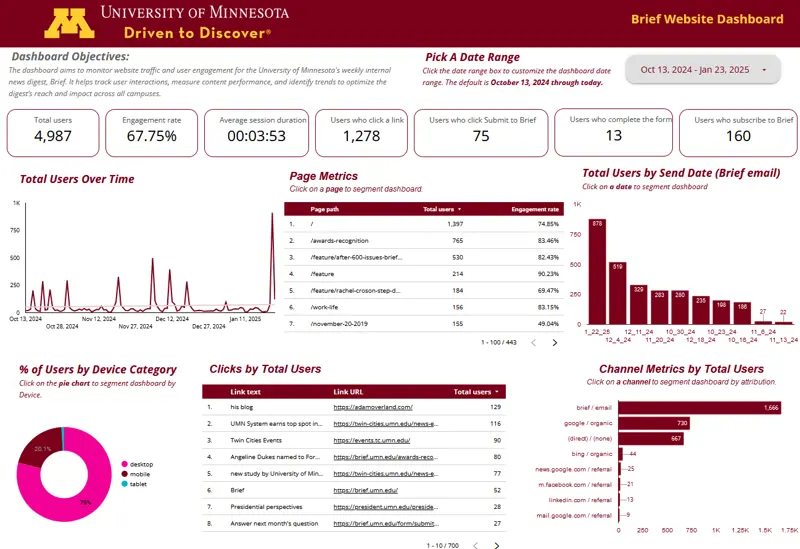
Description
The dashboard aims to monitor website traffic and user engagement for the University of Minnesota's weekly internal news digest, Brief. It helps track user interactions, measure content performance, and identify trends to optimize the digest’s reach and impact across all campuses.
Authors: An Nguyen and Eric Meyer - University of Minnesota
Versus
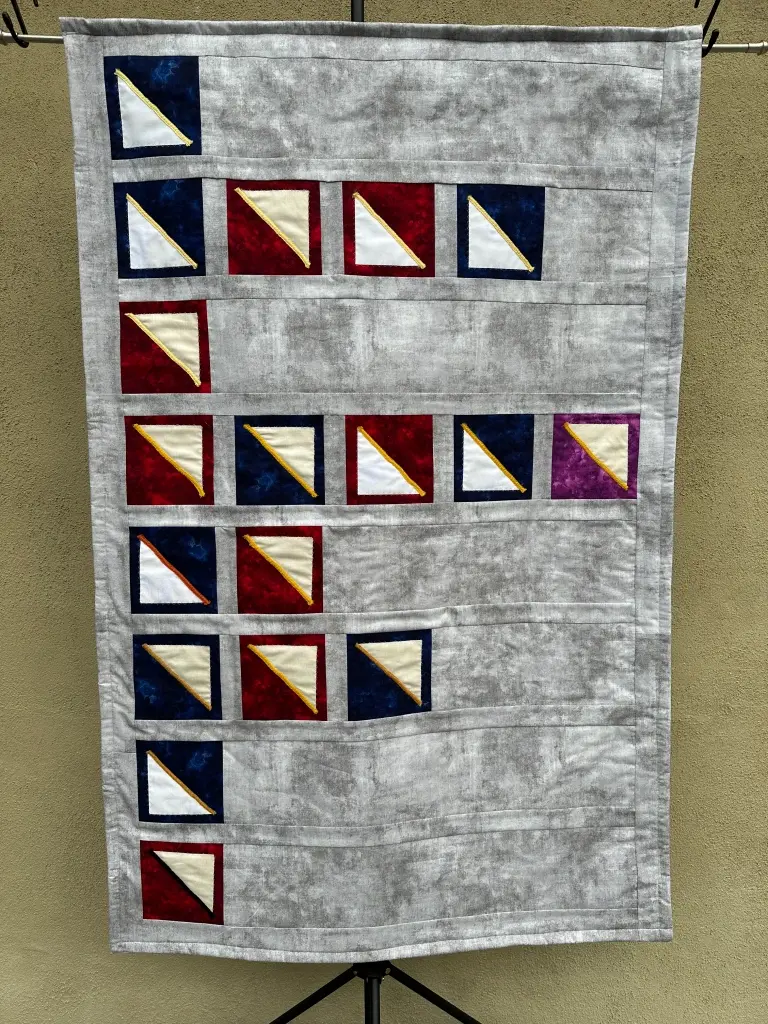
Description - Versus - a data visualization quilt - YouTube
This hanging quilt is a data visualization that captures a snapshot in college football history of all games played between the University of Nebraska and Penn State University. Each square represents one of the 18 games played between these two institutions from 1920 through 2020.
School colors were used with the squares and triangles contained within – scarlet and cream for Nebraska, blue and white for Penn State. The color of each large square represents which institution/stadium was the home team, and the color of the triangle represents the institution that won that match-up. The one square that is yellow/tan is for the game held at Giants Stadium (NJ) for the inaugural Kickoff Classic.
The yellow yarn stitched diagonally through each square is a gradation of light-to-dark yellows and oranges representing the lowest number in attendance (9,000 for the next highest attendance, etc.) to the highest number (110,753). The black yarn represents the absence of any fans in the stadium, and the game was played in 2020.
• Lightest yellow = 1 - 9,999 fans
• Sunshine = 20,000 – 39,999 fans
• Saffron = 70,000 – 89,999 fans
• Yellow Icelandic wool yarn = 90,000 – 109,999 fans
• Carrot/orange = 110,000+ fans
For the rows with more than one square, this reflects when the two universities played in consecutive years.
Author
Laura Guertin - Penn State University
IMPACT Data Summary - Purdue Main Campus
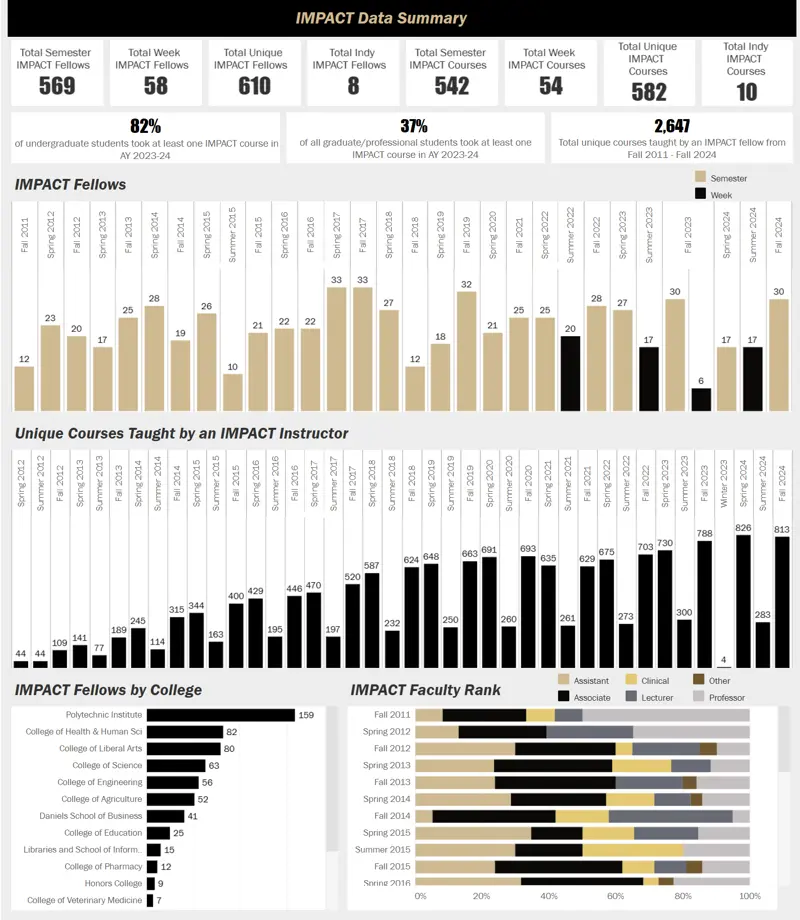
Description
Purdue University’s Instruction Matters: Purdue Academic Course Transformation (IMPACT) program is a faculty development program that supports instructors from all disciplines university-wide. IMPACT has continued to lead the way in large-scale faculty and course transformation for over a decade. Launched by the Office of the Provost in 2011, IMPACT is a large, collaborative initiative serving the Purdue West Lafayette and Indianapolis campuses.
IMPACT uses a cohort-based model built around a strong faculty learning community (FLC). The program is guided by the theoretical framework Self-Determination Theory (Deci & Ryan, 1985; Ryan & Deci, 2017), which is a motivational theory that posits the existence of three basic psychological needs, which when fulfilled, contribute to the creation of a student-centered, autonomy-supportive learning environment. This environment fosters student engagement and competence and leads to increased attainment of course-specific learning outcomes, degree completion, retention, and graduation rates.
IMPACT supports instructors in enhancing their pedagogical practices to create autonomy-supportive and inclusive learning environments to foster student success.
Specifically, the IMPACT program supports faculty’s ability to:
- Implement pedagogical practices that are student-centered, autonomy-supportive, and engaging
- Create learning environments that are equitable and inclusive
- Adopt a scholarly approach to instruction and contribute to a community of practice
Authors
Emily Bonem, Chantal Levesque-Bristol, Rachel Fundator, Jeff Chicki, Cody Connor, David Nelson, Clarence Maybee, Loran Parker, Taylor Stayback - Purdue University
Staff Contact
Lori Frost
Program Manager
Programs Team
Phone: (217) 333-9228
Email: lori.frost@btaa.org
Institutional Coordinators
Illinois – Amy Edwards (aledward@illinois.edu)
Indiana – Bridgett Milner (bharsh@indiana.edu)
Iowa– Matthew Anson (matthew-anson@uiowa.edu)
Maryland – Michelle Appel (mappel@umd.edu)
Michigan – Tracy Pattok (tpattok@umich.edu)
Michigan State – Bethan Cantwell (cantwelb@msu.edu)
Minnesota – Colin Delong (delo0041@umn.edu)
Nebraska – Jason Casey (jcasey10@unl.edu)
Northwestern - Debbie Crimmins (d-crimmins@northwestern.edu)
Ohio State – Maureen Henry (henry.371@osu.edu)
Penn State – Paulina Krys (pmk5516@psu.edu)
Purdue – Andrea Pluckebaum (apluckeb@purdue.edu)
Wisconsin– Beth Helmueller-Perkins (helmuellerpe@wisc.edu)